An Investigation of Belief Transmission among Human Networks
21 May 2019
Warning: Graphics include colorful and flashing images.
I. Introduction
In the modern interconnected world with the Internet and tighter social networks, beliefs, opinion, and
information quickly disseminate between individuals. In this post, we will discuss and visualize certain
forms that these phenomena might take on, with situations modelling various societal pursuits such as the
sharing of information, spread of political beliefs, fashion and relative status, and unpopular opinions.
From each scenario, we will also explore potential applications and connections with various topics in
information, logic, and social psychology that make appearances in real life.
Our cellular automata model uses a naïve assumption of a 30x30 pixel grid with 4-way connections between all
individuals. In this post, we focus more on the computational modelling and visualization of different
dynamics of change within this simple model, rather than the structure of the network, which can be equally
influential of information spread.
Our goal is to draw observations on the patterns of belief revision within a society, especially regarding
competing beliefs or those that change due to other beliefs. A few questions we aim to investigate are:
1. How might beliefs spread through society given varying parameters of belief spread and appearance?
2. How might beliefs spread through society when considering other individual-based factors such as
trustworthiness?
3. How might beliefs spread through society when considering belief-based factors such as competing beliefs
and perceived status/popularity of beliefs?
We draw inspiration from the cellular automata structuring of Kevin Simler’s Going Critical and social psychology musings from Scott Alexander’s Slate Star Codex . Through the design and testing of various parameters regarding thresholds and states of individuals, we aim to visualize patterns and draw conclusions on how existing cultural phenomena in real life might be similarly modelled, or even how current trends might be predicted.
II. Assumptions
Across the board, we will model our society using a 30x30 grid, with each node representing an individual with a state. It will also be generally assumed that each node is connected to the 8 other nodes in the square shape around it; these connections are the bridges for influence between nodes that human connections might fulfill. It is important to note that this 8-connectedness, as well as using an identical number among all nodes, is are large assumptions; the design of networks is a different discussion altogether, and this post will be focusing on a higher-level modelling and inspection of the parameters that could govern information transition.
III. Basic Models -- Information Spread
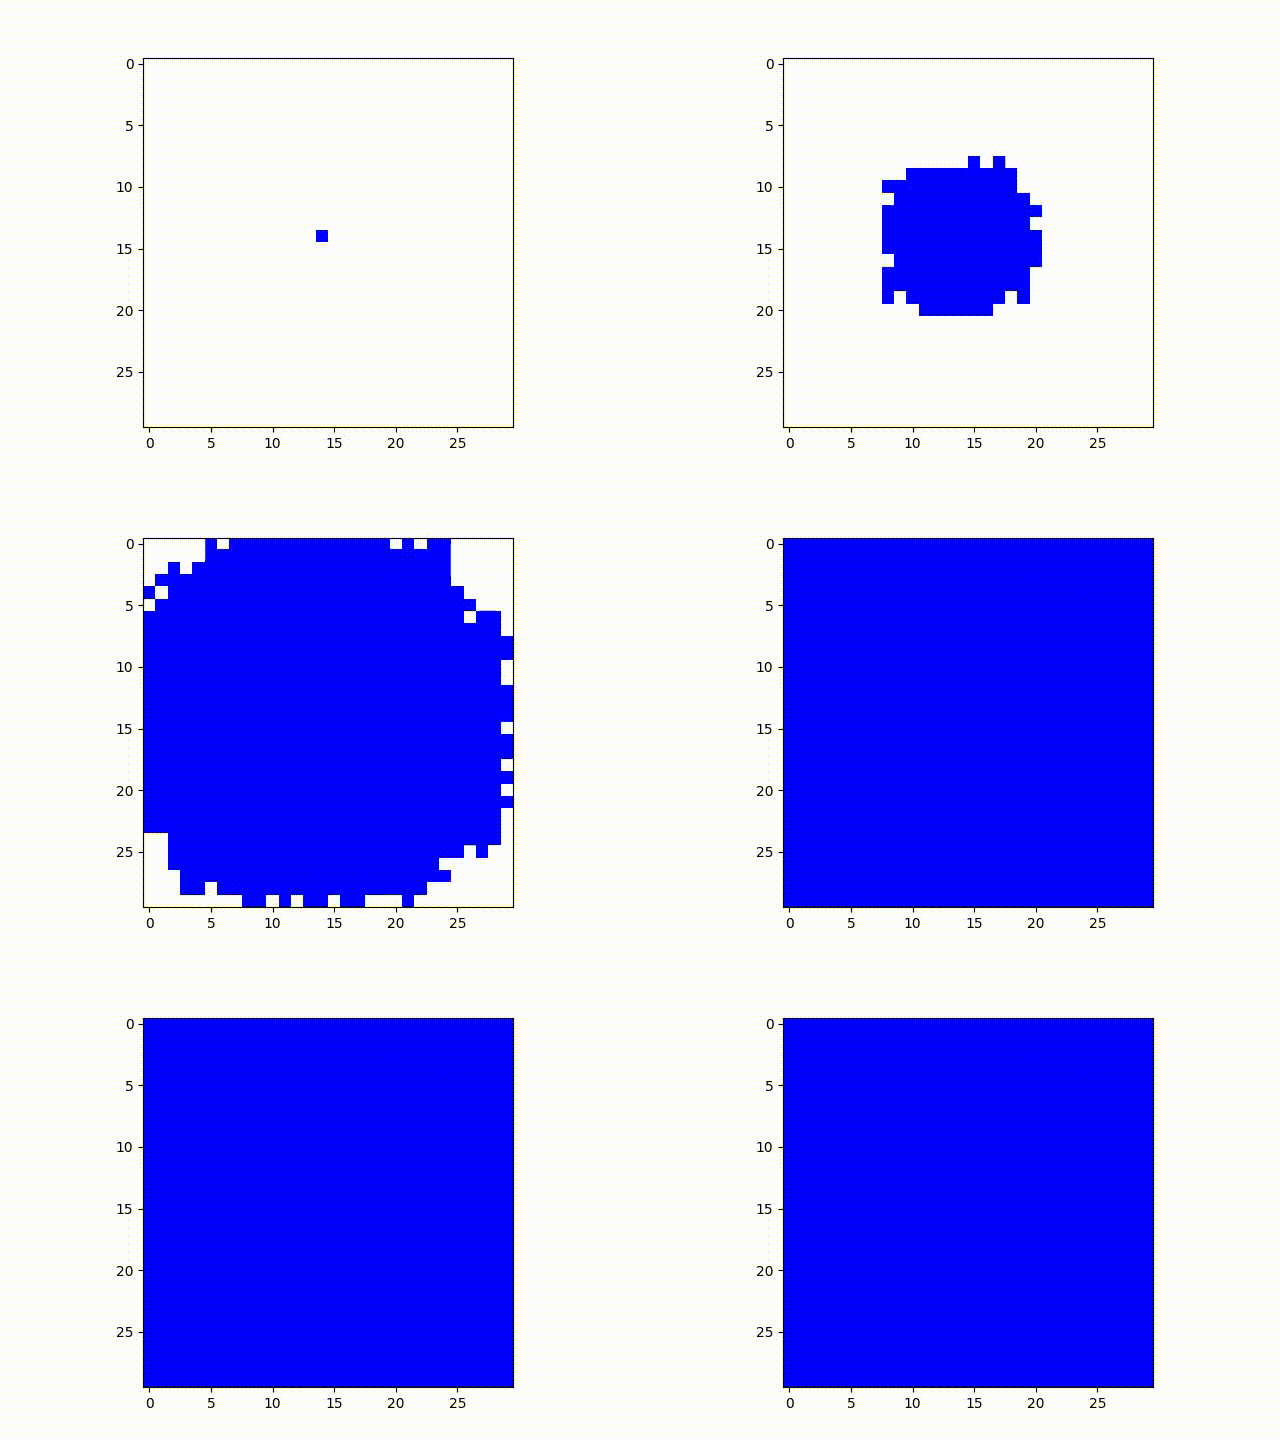
To begin, we’ll visualize a basic use of the system. We begin with a single node that has a state A
associated with it, and all others without it. At each step in time, let us consider each node that has
state A--all of its neighbors independently have a probability, in this case 20%, of taking on state A
if
they have not already. In less-specific casual terms, the probability of transmission of state A from
active
node to inactive nodes is 20%. Without other specifications, the entire grid eventually transitions from
state A.
Competing Beliefs
We will now investigate this model in light of competing beliefs in a society. We can also use this
model to
depict competing information and the idea of a first-mover advantage: when presented with competing
information, nodes will stick with what they heard first. We initialize the grid with two nodes that are
active, one with state A and one with state B, and the rest inactive. The difference, however, is that
one
idea spreads more easily than others. This might allow us to analyze how information that has
differences in
popularity to spread. For instance, often with news items, the first piece of information is what people
trust.
Below, both the red and blue states each have one node initialized at the beginning. However, the red
state
has a transmission rate of .15 vs. the blue state having a transmission rate of .25. It makes a
surprising
difference:
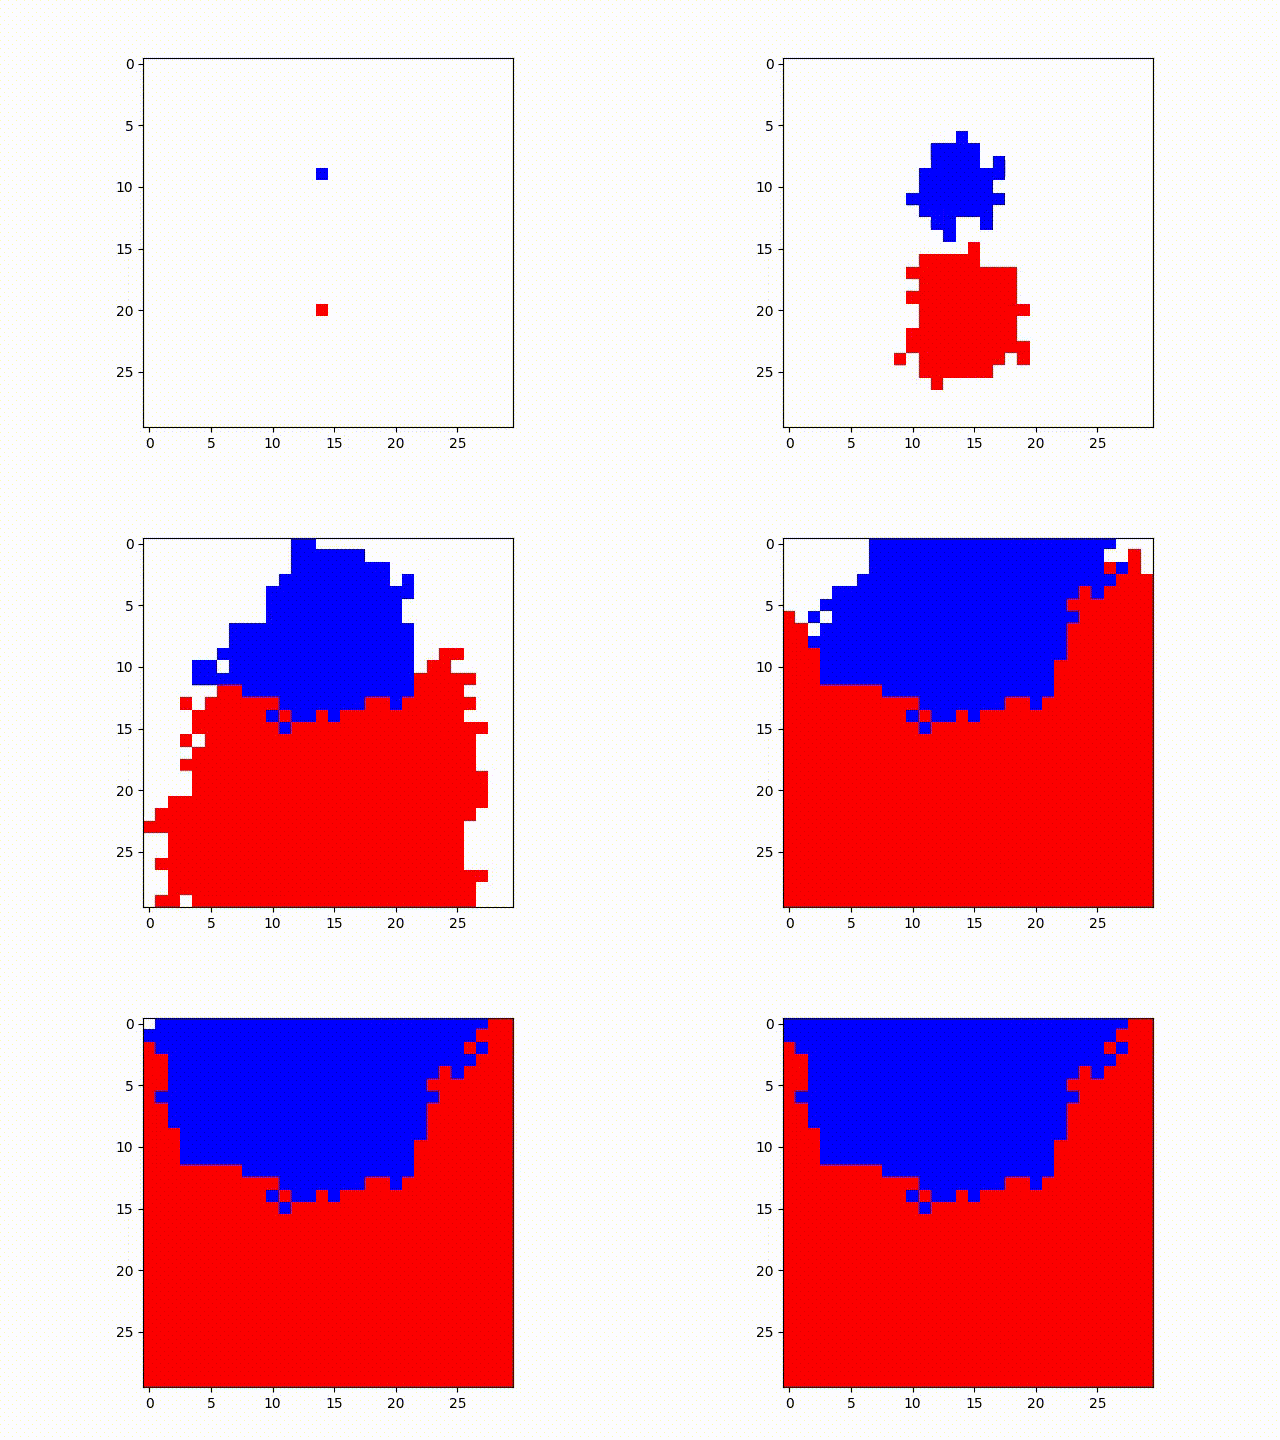
From this, we might take a lesson on considering the consequences of faster spreading ideas, particularly in the fast information flow of today’s digital society. Important concepts surrounding political elections, health information, and public consensus can be similarly influenced by ideas that have different speeds of transmission--which may be due to its clickbaity-ness, the authority figures that information comes from, or on what platform information is disseminated on. This is particularly relevant to instances such as when communities on Reddit and Twitter misidentified someone as one of the 2013 Boston Marathon bombers, and this story even reached ABC News, BBC, and Buzzfeed before the FBI made the real arrests.
Persistence of Information - the SIS model
Next, we explore what is called the SIS model. This model allows nodes to be in two types of states:
S: Susceptible. Nodes start out in this form, and susceptible nodes are able to become
Infected...
I: Infected. These are nodes that are active with a certain state. They can pass on the state to
connected Susceptible nodes. By the next time step, they go back to Susceptible...
S: Susceptible. Same as before, and the cycle could start again.
In real life, the SIS model with parameters could be used to represent the spread of a temporary
state through a population--this could include the spread of a common cold (which nobody can
become
immune to) or a trend.
Here are two examples, where the probabilities of transmission are both .15, but the
state fizzles out in one versus blooming in the other. After many runs this seemed to be the
threshold where, with an 8-connected grid, the state persists about half the time.
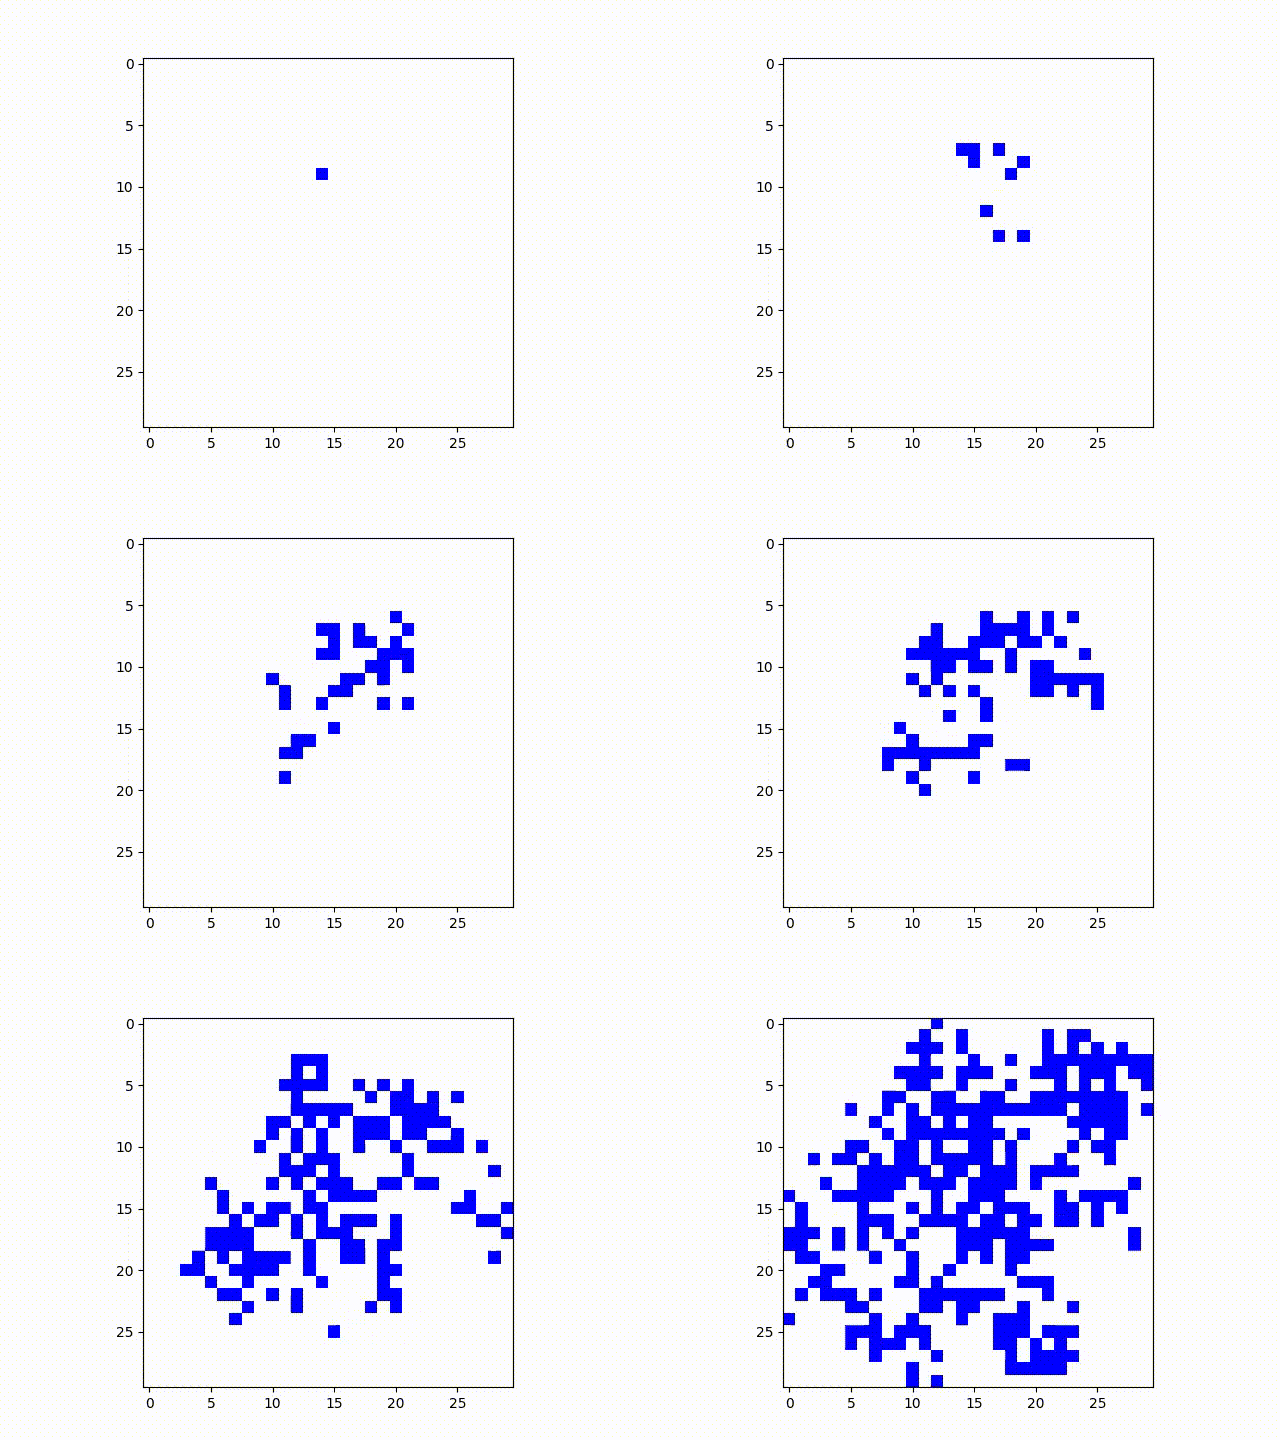
A SIS model with transmission probability .15 that remains alive.
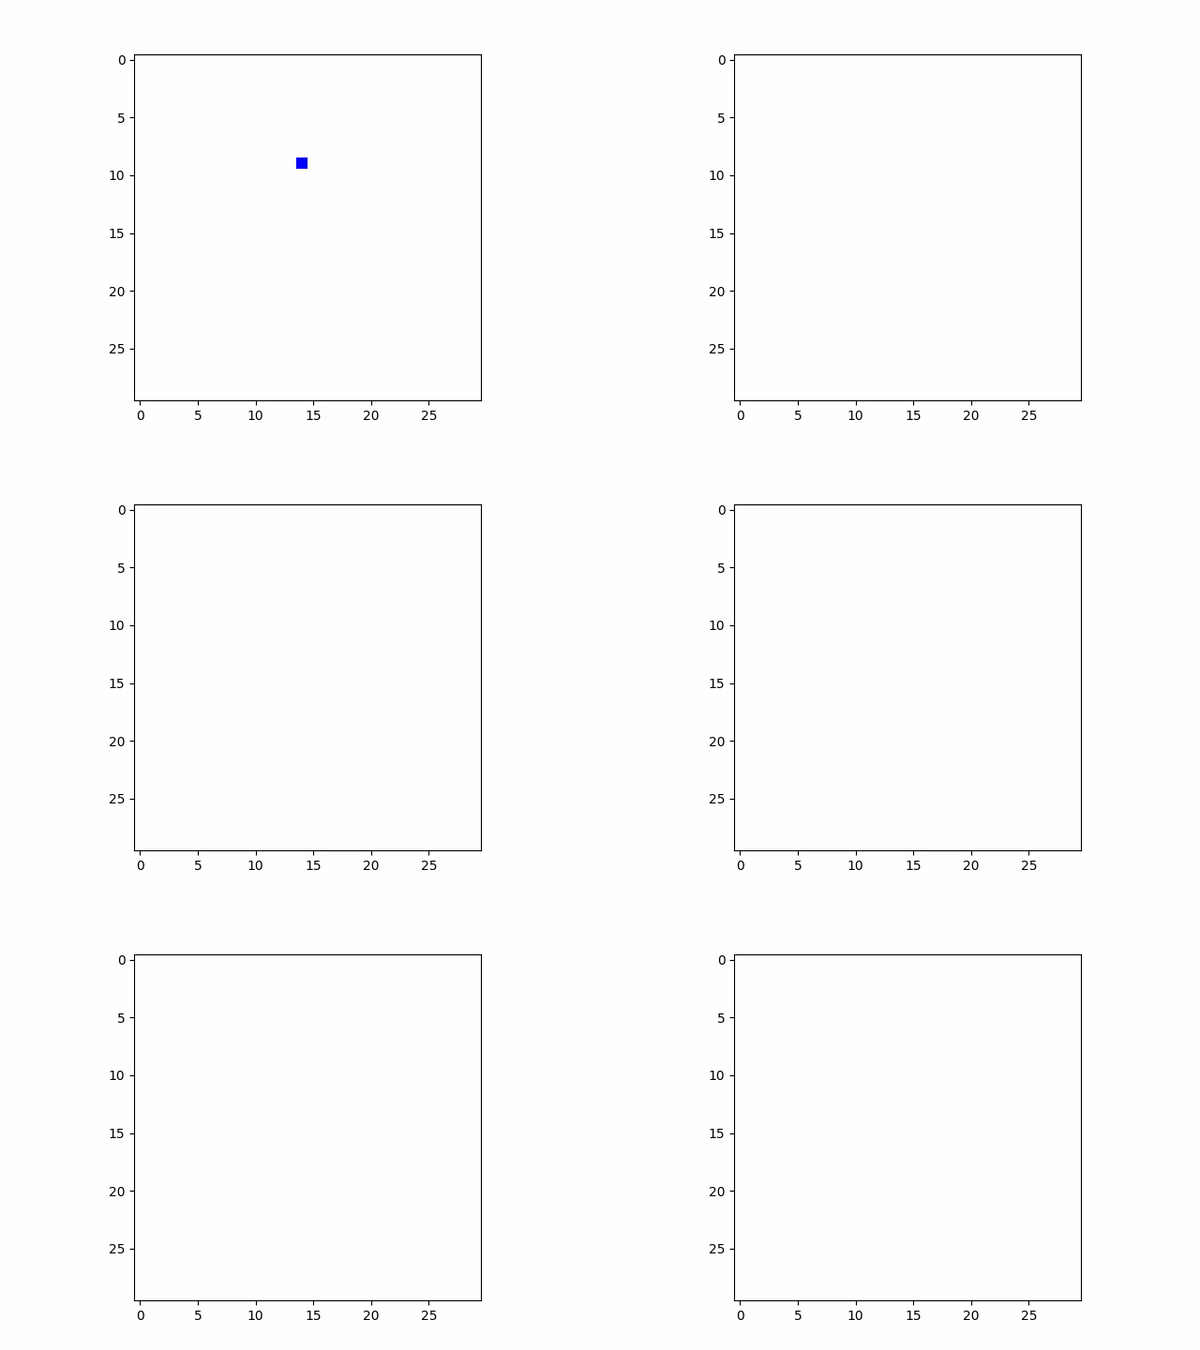
Another SIS model with transmission probability .15 that dies out.
IV. Conditional Spread - Political Beliefs
One can also model a society with more conditional parameters regarding spread, conversion, and retainment.
For instance, a more conservative opinion associated with less open-mindedness has a lower probability of
transmission in an open-minded area, but those holding that opinion might be less likely to convert as well.
This concept of stronger and weaker beliefs is investigated in Liu et al. 2014, and we will
now see about modelling it with automata.
A few examples are below:
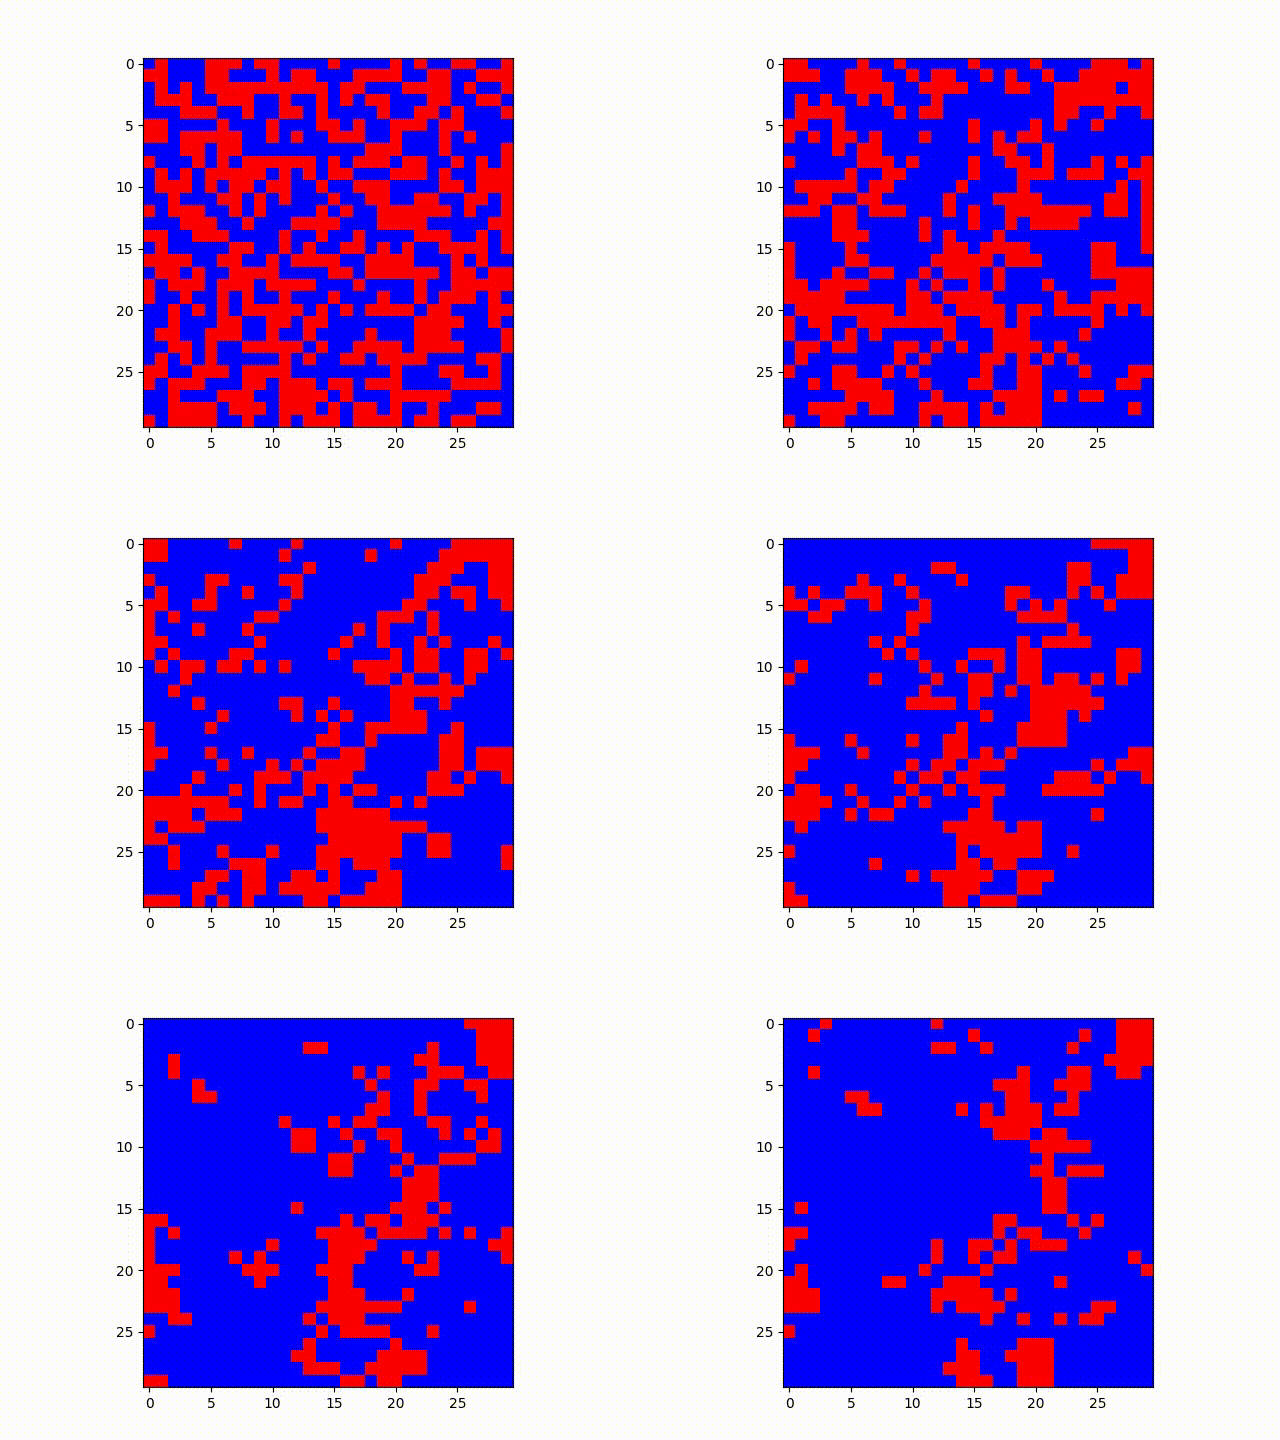
Blue has probability .25 of transmitting and Red has .04 chance of transmitting. However, when challenged, blue also has a .60 chance it will convert, whereas red has a .12 chance it will convert.
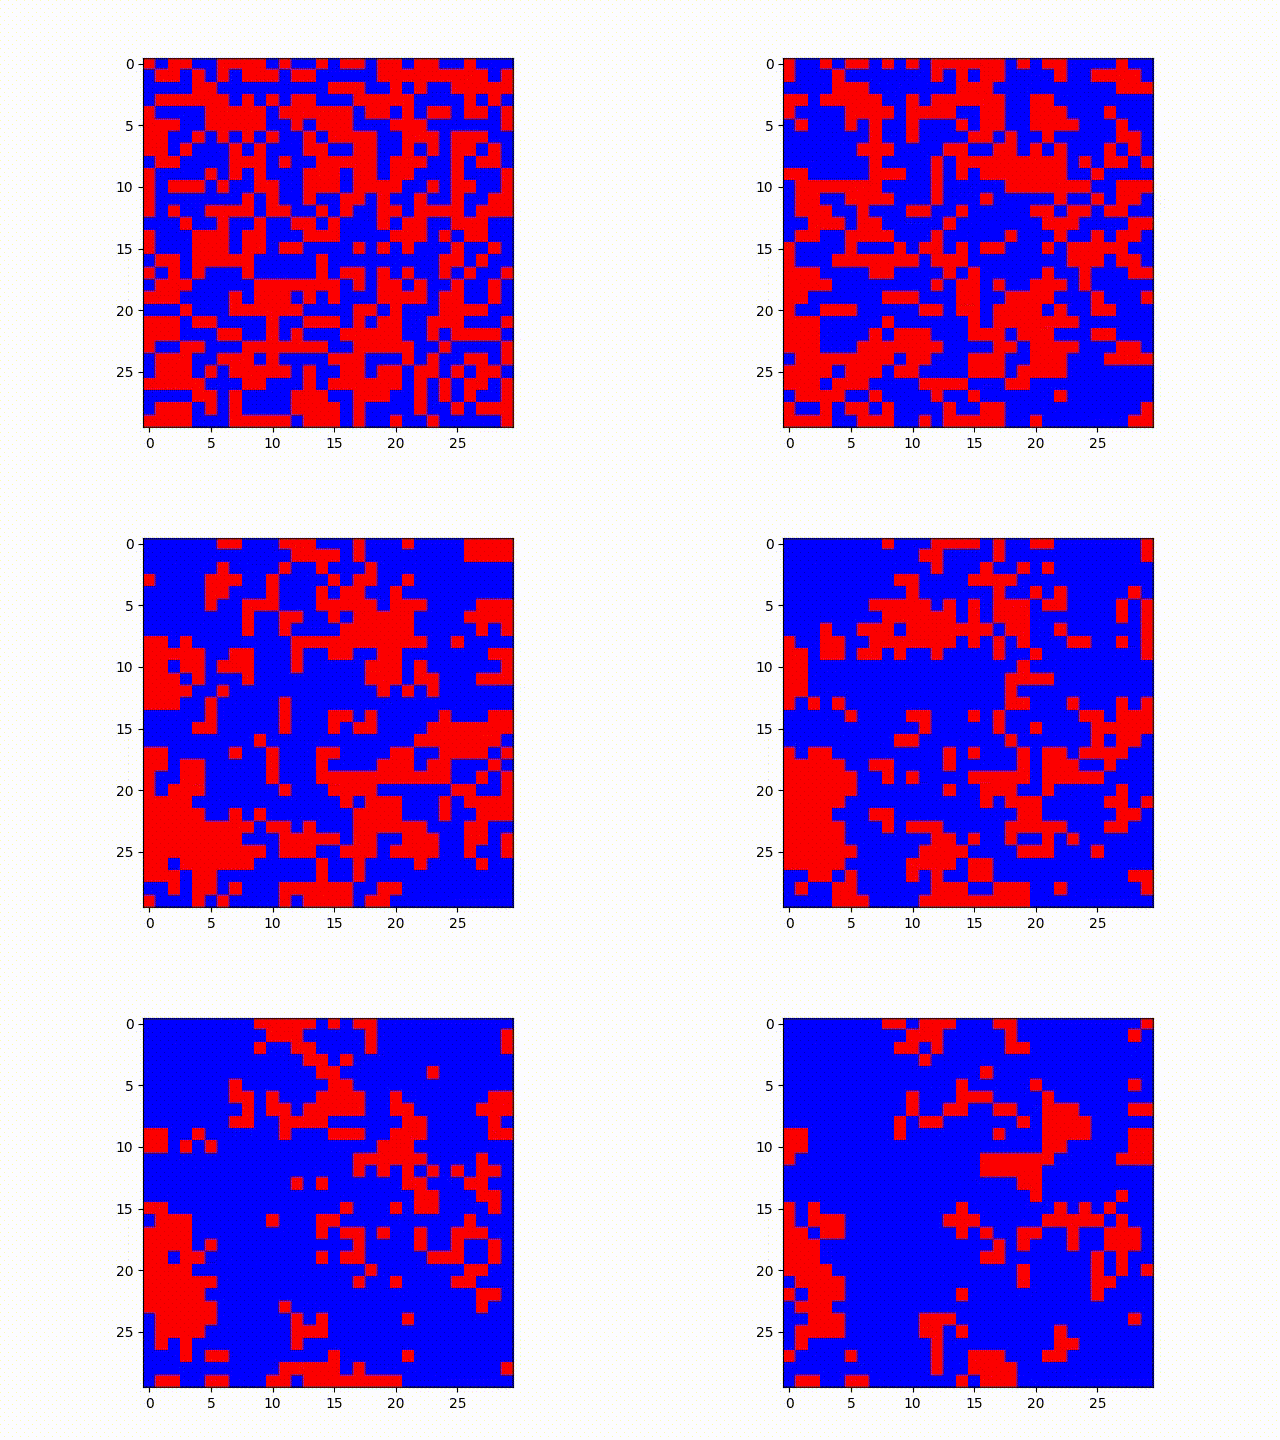
Same situation as before, except Blue has probability of .30 of transmitting and Red has .05 chance. Conversion chances are also .60 and .12 respectively.
In these examples, it makes sense that the red state, which has a lower transmission rate but lower probability of being converted to blue, ends up holding out in relatively defined clusters. One might imagine this analysis from a higher level as well--patterns such as these might be expanded to model geographic regions and political views, given many other factors can reinforce the “lower conversion rate” of some opinion of an area such as socioeconomic or demographic clustering in certain areas.
V. Fashion, or Relative States/ Status
Analyzing movements of fashion within a society can speak volumes about how those humans might seek to
differentiate or mimic other members of society. One easy parallel might be the concept of how fashion
captures both desirable socioeconomic status while acting as the path through which mimetic desire is
satisfied. This is briefly explored by Scott Alexander’s Slate Star
Codex, and now we will provide some visualizations of how this may play out.
Imagine that we have three hypothetical states: blue, red, and green. Assume individuals always want to
stand out from the state that many of their peers are in, and will automatically switch along that list in
ascending order. For instance, if a blue node is also surrounded by many blue nodes, it will become red. Red
would go to green, and the same applies for green nodes looping around the list to becoming blue.
This takes the more traditional form of cellular automata, where an item’s next state is dependent wholly on
its surrounding neighbors on the previous step. Below, an initial trend has begun, with each trend having an
equal transmission rate of .20 and individuals changing once they are surrounded by 3 nodes of the same
state.
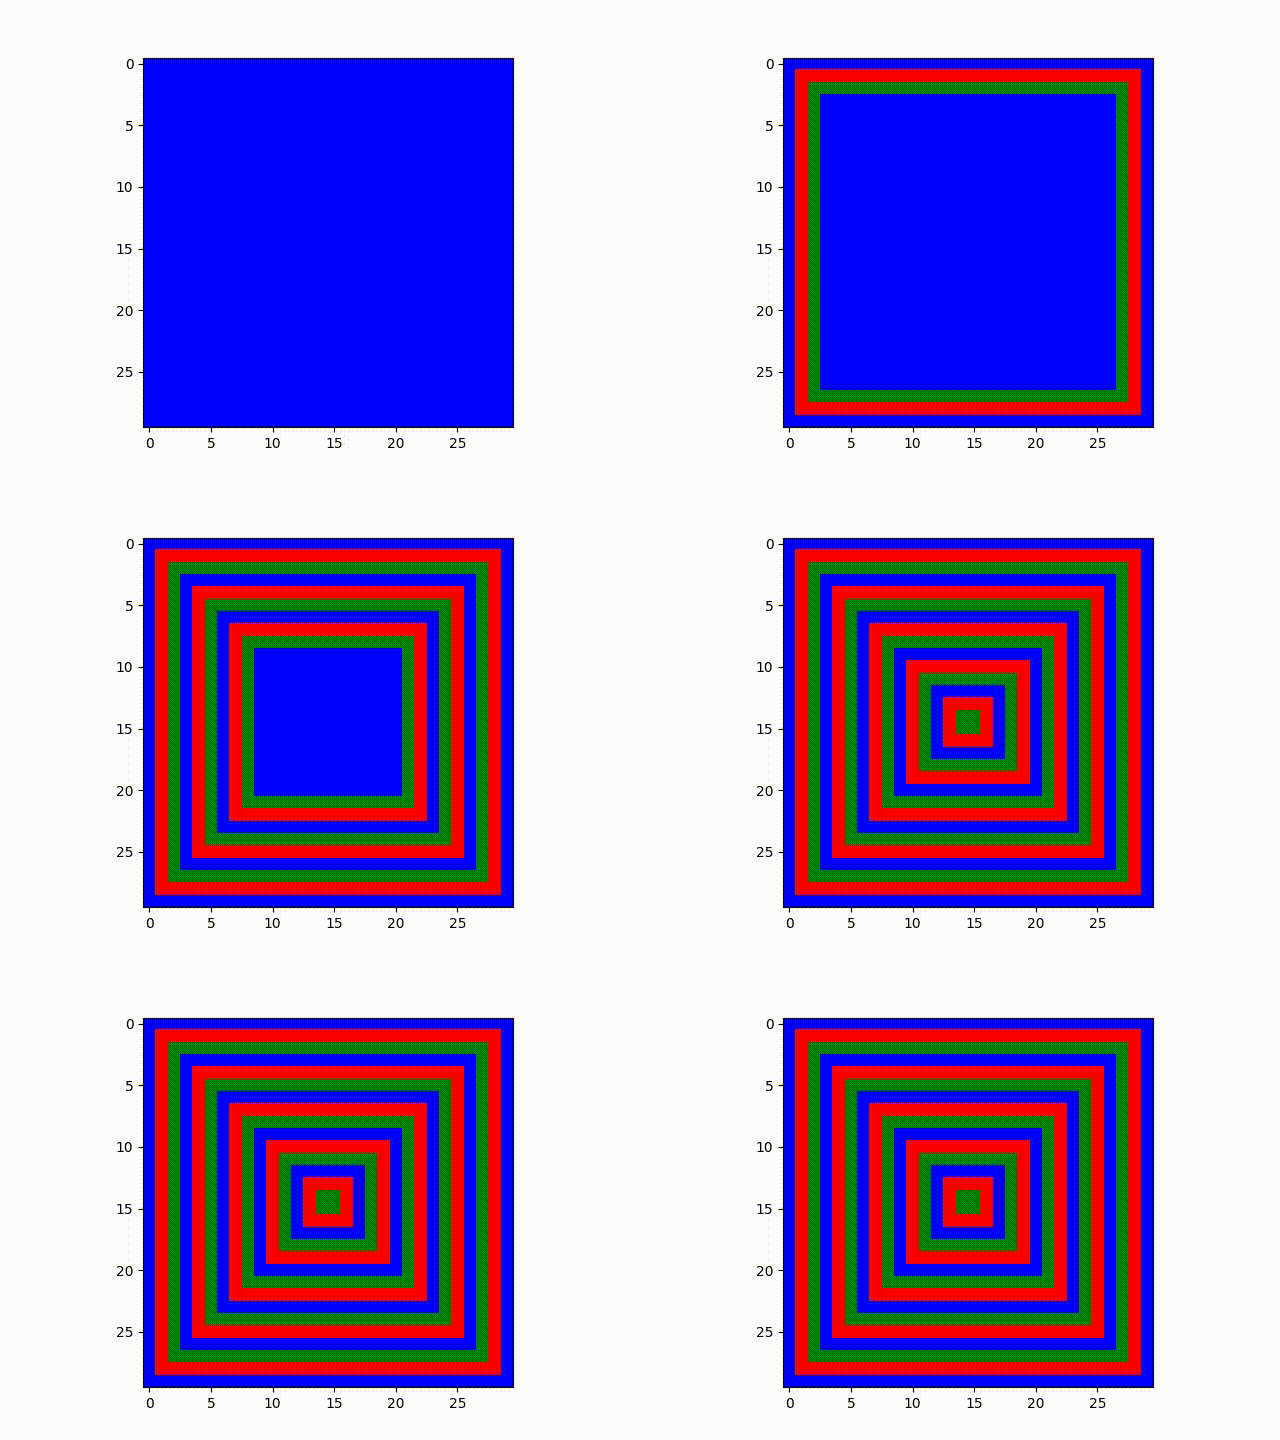
This version begins with all nodes initialized to one state. It results in a remarkable layer-by-layer
pattern, similar to the rings in an onion. Through our mechanism using these different colors to
communicate class, the apparent separation in this could even be compared with socioeconomic status and
real estate placement in human cities--throughout history, there are always divisions geographically on
where certain socioeconomic levels live. However, the initialization of all nodes being blue results in
the extremely fixed and unnatural square-by-square pattern.
We then implement a more organic model where nodes first start off as white, with a few initialized to
blue. All white nodes first must become blue before following the set pattern, and this results in an
interesting pattern: though the rules do not explicitly communicate it, there is geospatial convergence
for the position of clusters that change color but remain the same shape.
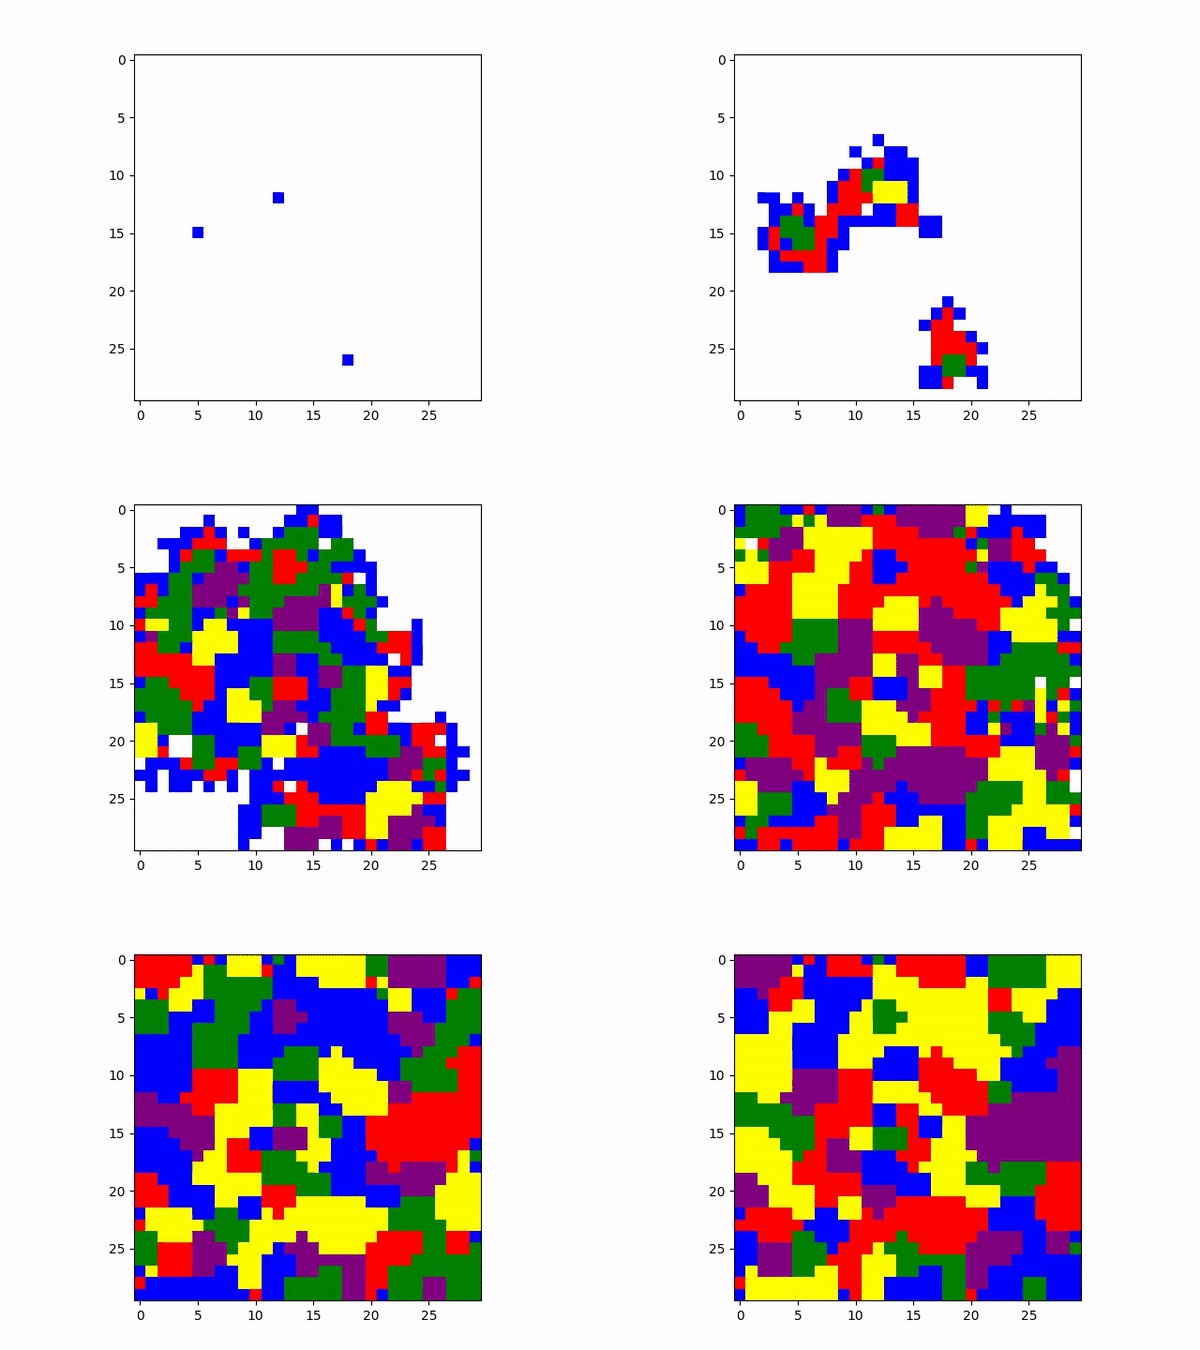
This might be interpreted as a visual model of how different neighborhoods with different “statuses” of any kind might emerge based on communities after initial growth. Furthermore, the persistence of the shape of clusters (though they change color) also speaks towards the idea how wealth and communities might become deep-rooted and immovable after initial growth and establishment.
VI. Secret Beliefs
Particularly in the modern discussion sphere, one term that might feature alongside concepts such as
distributed and common knowledge is the idea of a “silent majority.” The general case is a belief or state
among a population that is not overtly expressed without some stimulative factor.
We seek to model this scenario by imagining two opinions on a given topic, with opinions popular and
unpopular. However, three states are used to represent people’s expressions of these two opinions: the
‘popular-show’ and ‘unpopular-show’ states where individuals openly express either opinion, and the
‘unpopular-hidden’ state, where people truly believe in the ‘unpopular’ opinion, but for the purposes of
some observation, they appear to express ‘popular’. One hypothetical situation where this might be
applicable is when someone’s independently held, unpopular opinion might be kept secret for fear of
retaliation from a few vocal individuals who believe in popular opinion.
However, in certain circumstances, one might feel comfortable with sharing these controversial opinions with
an individual they are acquainted with that we will refer to as a friend--particularly if the friend has
publicly signalled their belief in correlated opinions, has publicly signalled a moderate position on most
opinions in general, or has gained the trust of the sharer. We thus model the potential for
these ‘unpopular-hidden’ states to become ‘unpopular-show’ states, which is equivalent to these ‘silent’
individuals becoming ‘vocal,’ so to speak. In the following model, an ‘unpopular-hidden’ node transitions to
‘unpopular-show’ if there are 3 other ‘unpopular-show’ nodes nearby in the previous time step. Furthermore,
we have set it such that, at the point of 5-10 time steps since the beginning, still-existing
‘unpopular-show’ nodes transition to ‘popular-show,’ to model their conversion if they do not find other
agreeing nodes within time.
One interesting thing is that, albeit with these particular and strong assumptions for these models, it
theoretically first appears that the ‘popular’ opinion is most popular, when in reality the ‘unpopular’
opinion, when tallied for both expressed and hidden, is the true majority. Of course, the key assumption is
that information transmission occurs in this manner at all, and that these initializations of belief
distributions hold true.
This model might be utilized to depict scenarios where opinions have a high likelihood of being transmitted
among individuals in a population and some sort of ‘silent’ mechanism is in play, such as when individuals
might be pressured into saying the publicly acceptable position when they might not truly believe it, but
through interactions with others eventually find the space to act on their allegiance.
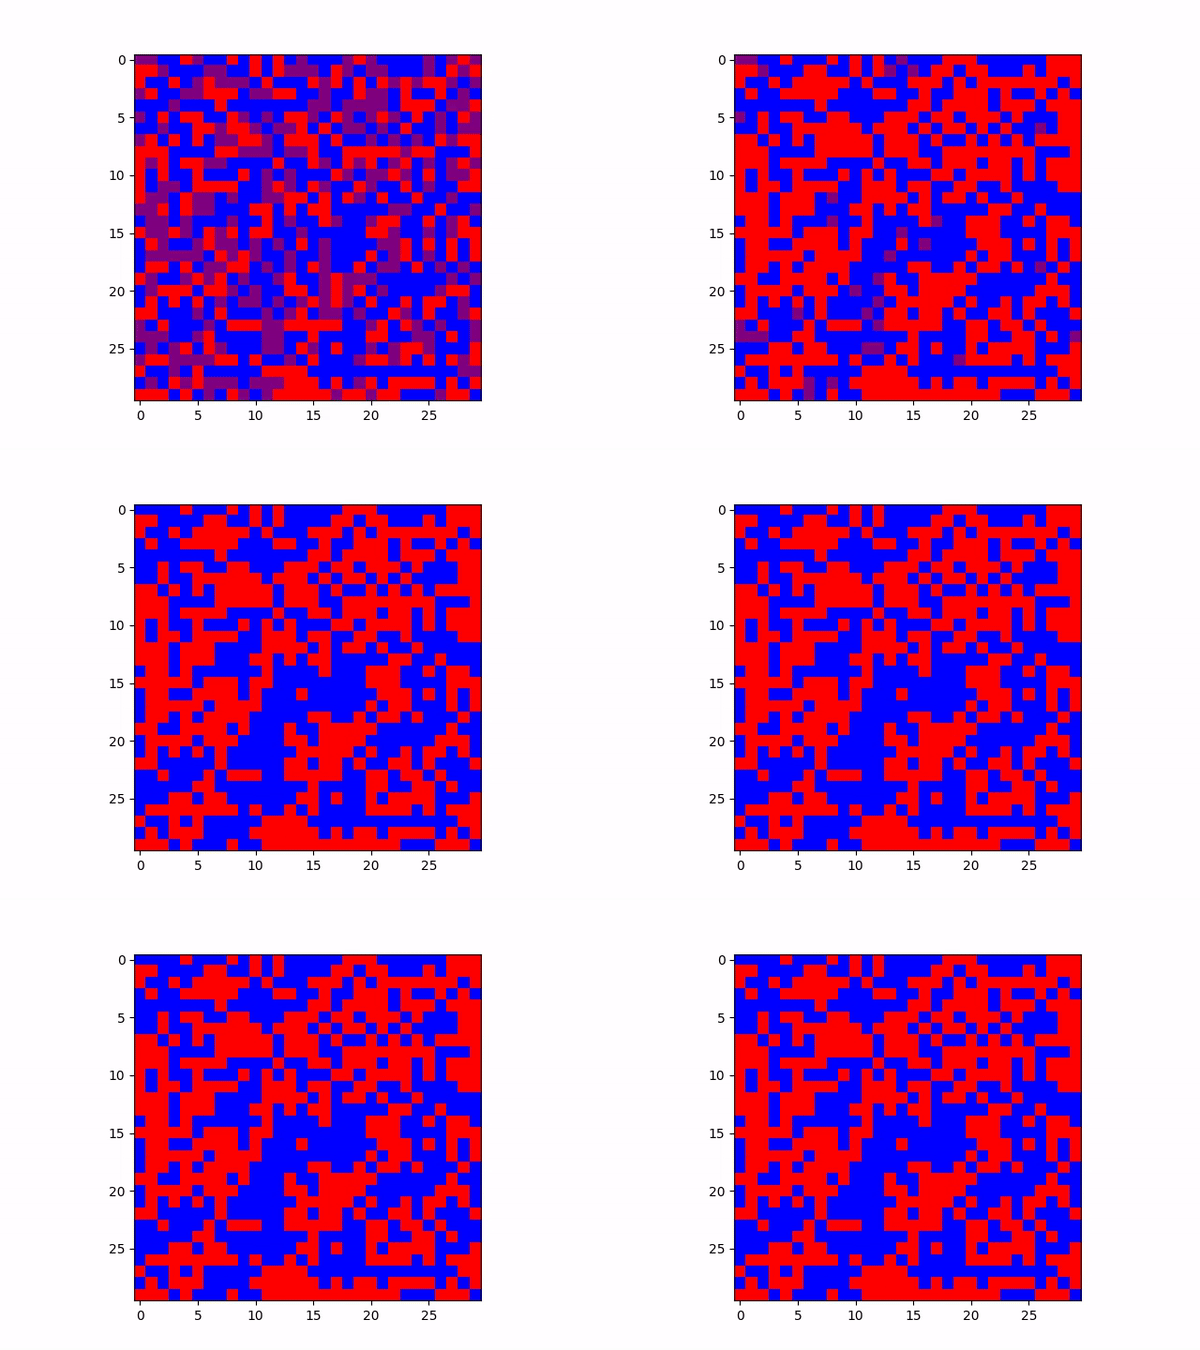
Blue: 'popular-show,' Purple: 'unpopular-hidden', Red: 'unpopular-show'. One can interpret 'unpopular-hidden' as popular-opinion holders as they hide the unpopular opinion.
This simulation is also quite interesting; it is initialized as 40% ‘popular,’ 30% ‘unpopular-hidden,’ and
30% ‘unpopular.’ Naïvely, this would first seem as 70% popular, 30% unpopular, with our idea of
'unpopular-hidden' being expressed by those individuals as facetiously being 'popular'. But even though the
30% of ‘unpopular-hidden’ are destined to switch to the ‘popular’ side, they are contacted enough by the
‘unpopular’ opinion nodes such that the final tally is popular with 49.5% and unpopular with 50.4%!
This could be a rough analogy for voting situations and why it is important to push for a ‘popular’ position
(which, in this model, the ‘popular’ state here lacks), even if the ‘unpopular-hidden’ voters would switch
over eventually--the ‘unpopular’ position might sway those individuals with select information that could
pull them over before they fallback to the ‘popular’ position.
VII. Conclusion
Cellular automata and digitally modelled societal connections can be parameterized in various ways to provide useful models for understanding belief revision within a community. In creating a few models for various overarching patterns for how states transmit, compete, and change within a society, we’ve created a few visualizations with emerging properties that anecdotally appear to naïvely model some few real life phenomena patterns regarding fashion, status, and opinions.
VIII. Next Steps
Potential next steps include:
- Ability to adjust parameters and run experiments live, à la Going Critical
- Investigation into time-series nature of some experiments
- Effect of varying initializations and parameters on Fashion and Secrets experiments.